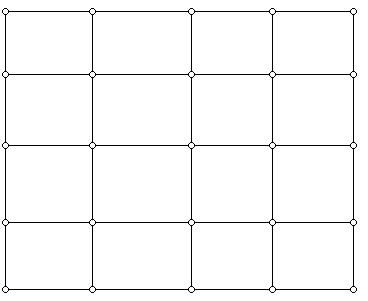
Figure 1 (A 4 x 4 grid graph)
The Unifying Power of Graph Theory (Spring, 2015)
Prepared by:
Joseph Malkevitch
Department of Mathematics
York College (CUNY)
Jamaica, New York 11451
email:
malkevitch@york.cuny.edu
web page:
http://york.cuny.edu/~malk
When students look at a simple geometrical shape - a triangular prism consisting of two equilateral triangles and three squares (or two equilateral triangles and three congruent rectangles), they will use terms like corners, sides, edges, faces, polygon, segments, portion of a line, parts of planes, polyhedron, etc. to describe what they see.
From a modern perspective, when geometers talk about lines and points, especially in an axiomatic framework, they are thinking of point and line as undefined terms. However, common shapes like polygons and polyhedra are often described using the same terminology.
Some unifying "order" is brought to these diverse terms by the use of the ideas from the branch of geometry, discrete mathematics, and combinatorics that has come to be called graph theory. As a branch of mathematics, graph theory goes back to Leonhard Euler in the 18th century. The basic idea is that one has a finite collection of dots called vertices and a finite collection of straight line segments or curves that join up these dots subject to certain rules. The line segments (curves) are called edges. The length of the segments typically does not matter. Graph theory usually looks at the structure of geometrical objects rather than paying attention to such matters as distances, angles, areas, etc. The power of graph theory is that if one is not interested in metrical (distance) issues, graphs are a way of talking about polygons and polyhedra (and many other geometrical structures). Figure 1 shows a very special kind of graph (sometimes called a grid graph) which might represent a portion of an urban street network. This graph is an example of a plane graph because it has been drawn on a flat piece of paper so that edges meet only at vertices.
You can verify that this graph has 25 vertices, and you can count for yourself the number of edges. It also has "regions" which are called faces. Most of the faces in this drawing are quadrilaterals (4-gons), but there is one region, called the "infinite face" which surrounds the picture drawn which has 12 edges (12-gon). You can check that Euler's famous "formula," Vertices + Faces - Edges = 2 holds for this geometrical object.
Polyhedra are usually thought of as 3-dimensional (or higher dimensions) but we often draw them on pieces of paper to help us visualize them or talk about them. For example, some different ways to represent a cube (edge lengths all equal, and faces which are squares) in the plane is shown in Figure 2. However, some of these diagrams have accidental crossings, in particular, the diagram in the top row on the right, which is one of the most common ways to try to give a 3-dimensional sense for a drawing which is only in 2 dimensions.
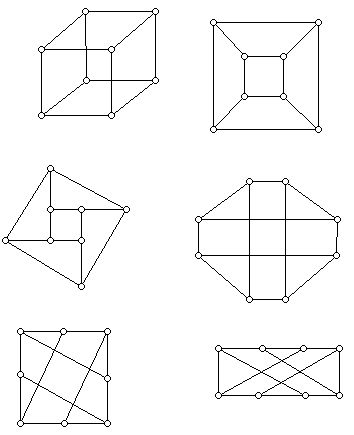
Figure 3 shows a "net" for the cube - a polygon (with diagonals) which can be folded up and its boundary edges "taped" to get a cube. It, too, can be thought of as a graph (with the "obvious" candidates for its vertices), but the graph in Figure 3 is not isomorphic to those in Figure 2. There are surprisingly many different nets for the 3-cube. It is instructive to try to draw them all.
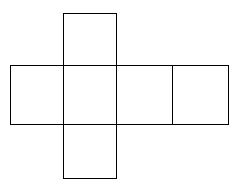
Figure 3 is also an example of a geometric structure called a polyomino. These are assemblages of squares in the plane created by pasting together squares edge to edge. Figure 1 is also an example of a polyomino.
When you look at Figure 1 you may notice that the points (vertices) in the picture lie along lines. In the Euclidean plane two points determine a line. If we have three points on one line, the lines that each pair of these points determines is the same line. However, the lines that the vertices lie on in the drawing in Figure 1 are not the "same" as the edges of Figure 1 when one thinks of that figure as a graph. To understand better the difference between edges and lines you may want to count the number of edges in Figure 1 as well as counting the number of lines that the vertices in the diagram determines.
Another interesting thing to do in Figure 1 is to count the number of points that lie on different lines determined by the vertices. There are lines in Figure 1 that have 5 points, others with 4 points on a line, and some with 3 and 2 points on a line. In the 19th century the great English mathematician James Joseph Sylvester asked the following question. If one has a collection of points S in the Euclidean plane, which don't all lie on a line, is it possible that there are no 2-point lines? For all of the diagrams in Figures 1-3 you can verify that if S is the vertex set in the diagram, there are always 2-point lines. Amazingly this simple question went unanswered for many years until the mathematician Tibor Gallai showed that the answer to Sylvester's question was no. This "fact" is now typically known as the Sylvester-Gallai Theorem.