Prepared by:
Joseph Malkevitch
Mathematics Department
York College (CUNY)
Jamaica, NY 11451
email:
malkevitch@york.cuny.edu
web page:
http://york.cuny.edu/~malk/
Using an example, we can show the value of constructing a table (matrix) where for a pair of candidates i and j we record the number of voters who prefer i to j and who prefer j to i.
We will assume that we have an ordinal ballot where each voter ranks all of the candidates (alternatives) without ties.
Example:
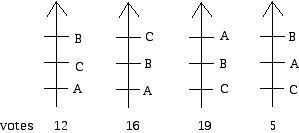
We can compute the Borda Count for each of the candidates in the election above:
A: 12(0) + 16(0) + 19(2) + 5(1) = 43
B: 12(2) + 16(1) + 19(1) + 5(2) = 69
C: 12(1) + 16(2) + 19(0) + 5(0) = 44
Since candidate B has the largest number of points, B would be declared the winner.
What is intuitively appealing about the Borda Count is that it does not operate by taking into account only first-place votes for a candidate. Rather it chooses an alternative which is highest on the average (as measured by the mean) of the alternatives to be chosen. More precisely, if we compute the Borda Count of an alternative ß divided by the total number of voters we obtain the average (mean) number of alternatives below ß.
Additional insight into the Borda Count (as well as the method of Condorcet which selects that alternative which beats every other alternative in a two way race, assuming such an alternative exists) can be obtained by constructing the pairwise preference matrix associated with an election. A matrix is nothing more than a table which consists of rows and columns. The rows and columns of the pairwise preference matrix are labeled with the alternatives being voted on. The entry in the row labeled X and the column labeled Y is the number of voters who prefer alternative X to Y in the election being considered. In the election above, for example, since A was preferred to B by 19 voters, the entry in row A and column B is 19. The pairwise preference matrix for the election shown above is given below:
A B C Row sum
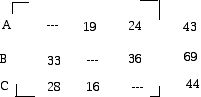
Note that the sum of the (X,Y) and (Y,X) entries in the matrix add up to the total number of voters and the row sums in the matrix are exactly the values of the Borda Count. This is not a fluke but always happens. Can you see any meaning for the column sums?
In this election, the sequential run-off winner would be candidate B. Since candidate C gets the fewest first place votes we eliminate C. In the run off B would win. We could also construct a run off based on the Borda Count. In this case, instead of eliminating B, we would eliminate A, since A got the lowest Borda Count. In the election between B and C using the Borda Count we get B as the winner. In this election, B is also the Condorcet winner. If we apply Coombs' Method, we eliminate A because A got 28 last page votes, C got 23 last place votes, and B got no last place votes. In the "run-off" between B and C, B would be the winner.
In this election, while the plurality winner is A, A does not win using run-off, the Borda Count, Condorcet, or Coombs. All of these methods yield B as the winner.